How a Bank Finds Its Own Root Cause in 20 Seconds
We run a real six-service bank that moves money continuously. When we stopped its ledger, the first alert fired in 20 seconds and the diagnosis named the dead service by name — not because a model guessed, but because the evidence was gathered first and the model was only asked to read it.
Key takeaways
- A dependency failure is detectable in seconds if you alert on something whose normal value is zero — root-span error rate and ERROR-log count both sit at exactly zero in a healthy system, so any movement is signal.
- The hardest failure to see is silence: a crashed service stops emitting, and every query that looks for errors will miss it entirely because the dead service produces none.
- Ranking incidents deterministically and asking the model only to explain them keeps the answer reproducible — two people looking at the same incident get the same ordering, every time.
- An alert whose threshold sits below the system's normal operating level can never turn off, and therefore can never catch anything new.
- Root-cause analysis is cheap when the expensive part is a database query: gathering the evidence for one incident took under four seconds across six services and millions of spans.
Most observability demos are performed on a toy. Three services, a synthetic error injected on cue, a dashboard that lights up. Nothing is really at stake, so nothing is really proven.
We wanted something that could actually be wrong. So we built a bank.
The Bank
It is six services across two machines, and it moves money the way a bank does — with an edge tier that faces customers and a core tier that owns the money.
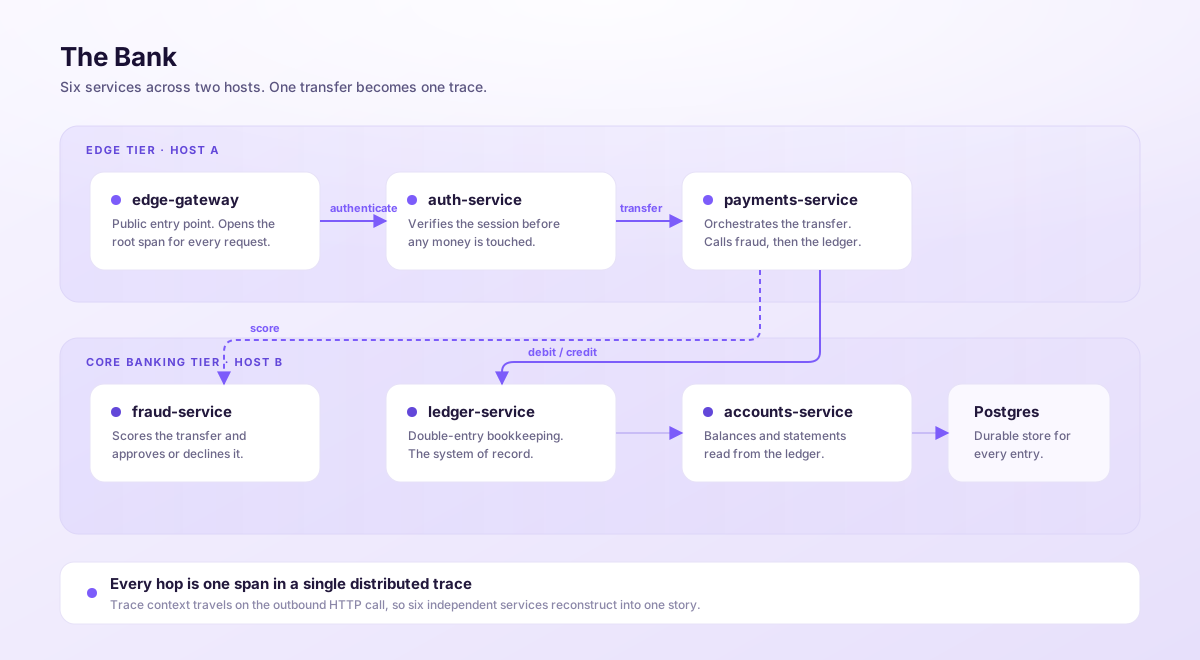
A transfer arrives at the gateway, which opens the root span — the one that represents the customer's actual request. Auth verifies the session before any money is touched. Payments orchestrates the movement: it asks fraud for a score, and if that comes back clean it calls the ledger, which writes a double-entry record to Postgres. Accounts reads from the ledger to serve balances and statements.
Nothing here is mocked. The ledger genuinely balances, transfers genuinely get declined for insufficient funds, and the whole thing has been running under continuous load for weeks.
730spans per second, steady state — about 63 million a day from six servicesThat volume matters, because it is what makes root-cause analysis hard. When something breaks, the evidence is real but it is buried in millions of records that all look approximately like each other.
What one request looks like
Here is a single failing transfer, as the product renders it.
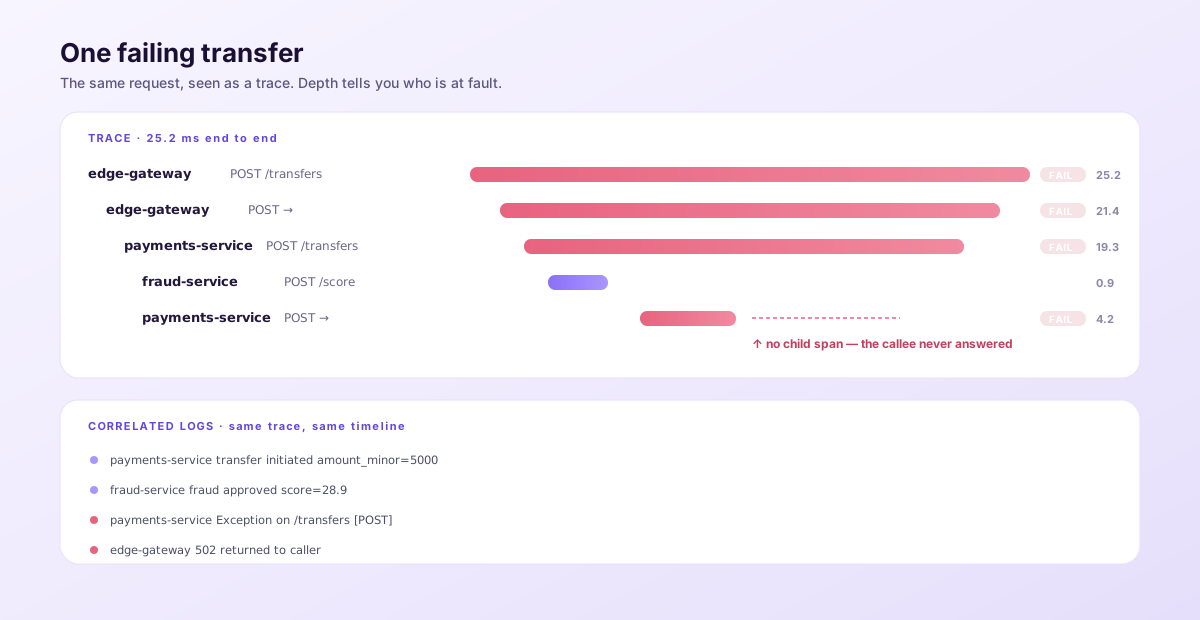
Read it from the bottom. The gateway failed, and payments failed, and the gateway's client call failed — but those are all just the failure travelling upwards. The interesting row is the last one: a payments client span that failed in 4.2 milliseconds with no child span underneath it.
That absence is the whole story. A child span would have told us which service was called and what it said. There isn't one, which means the callee never got far enough to report anything.
Stopping the ledger
To see whether any of this works when it counts, we stopped the ledger service outright. No graceful shutdown, no draining — the process simply went away, the way processes do.
Within seconds the shape of the system changed:
| Signal | Healthy | During |
|---|---|---|
| Root-span error rate | 0% | 37.7% |
| ERROR-level logs | 0 per hour | 5,283 in two minutes |
| Ledger spans | 13,630 per 5 min | 0 |
The alerts fired in this order:
| Alert | Detection time |
|---|---|
| Any ERROR or FATAL log | 20 seconds |
| Root-span error rate above 1% | 50 seconds |
| Warning-log spike | 4 min 20 s |
| Ledger service silent | 5 min 20 s |
The two fast ones share a property worth stealing: their healthy value is exactly zero. A well-behaved system produces no ERROR logs and fails no customer requests, so any movement at all is signal. You do not need a clever threshold when the baseline is nothing.
The slow ones are slow for a structural reason. A rule that asks "has this service gone quiet?" looks at a five-minute window, and for the first five minutes that window still contains healthy traffic from before the incident. You cannot detect absence faster than your window. That rule is confirmation, not detection — and it is worth having anyway, because it is the one that states the problem in plain language.
The part that is not a chatbot
Now the interesting bit. An alert says a number moved. The engineer's next question is why, and answering it is a mechanical slog: work out which service, pull its logs, filter to errors, find a failing request, walk the span tree, compare against an hour ago.
All of that is database work. So we do the database work first.
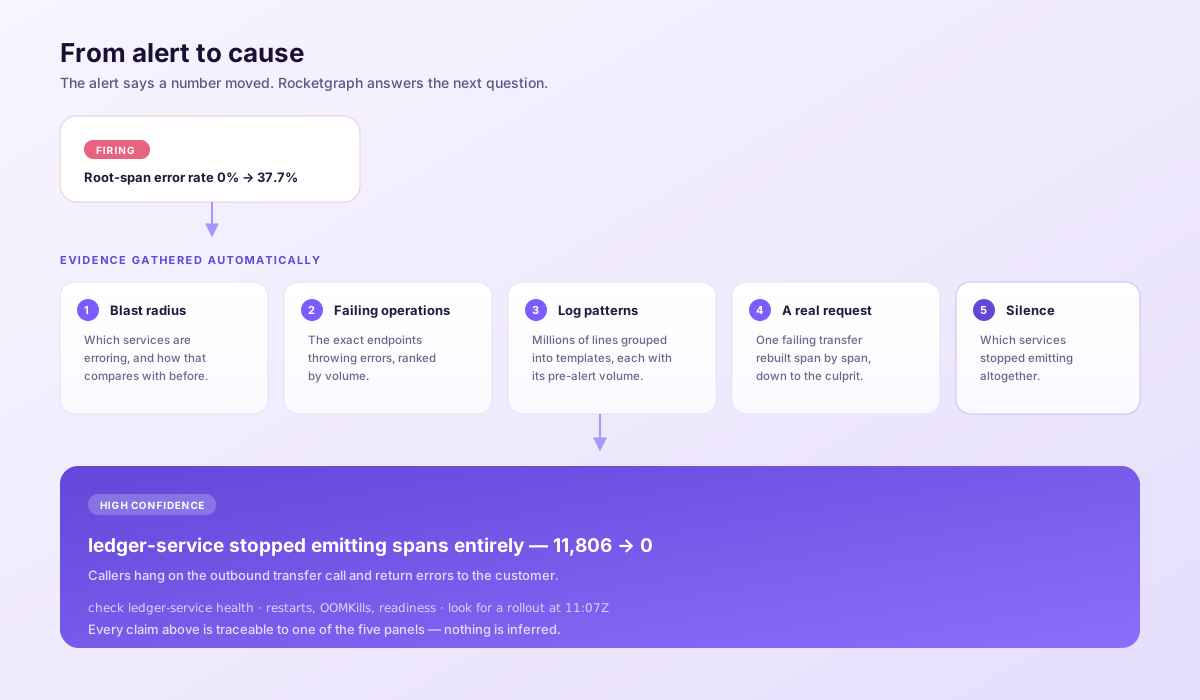
When an alert fires, five things are gathered before any model is involved:
- Blast radius — every service currently erroring, next to what it was doing before the alert.
- Failing operations — the exact endpoints throwing errors, ranked.
- Log patterns — millions of log lines grouped into a few dozen templates, each with its pre-incident volume, so a genuinely new message is obvious.
- A real failing request — one trace, rebuilt span by span, down to the innermost failure.
- Silence — which services have stopped emitting altogether.
That fifth one is the one people leave out, and it is the one that solved this incident.
Everything else in the list looks for errors. But a dead service does not error — it goes quiet. Its callers do the erroring, and all they can say is that something downstream failed to answer. Search the telemetry for exceptions and you will describe the symptom perfectly and never name the cause.
Ask instead which services were emitting before and are not emitting now, and the answer arrives immediately:
11,806 → 0ledger-service span volume, before and during — the single query that names the culpritOnly then is the model called, and it is given the evidence rather than the database. It came back with:
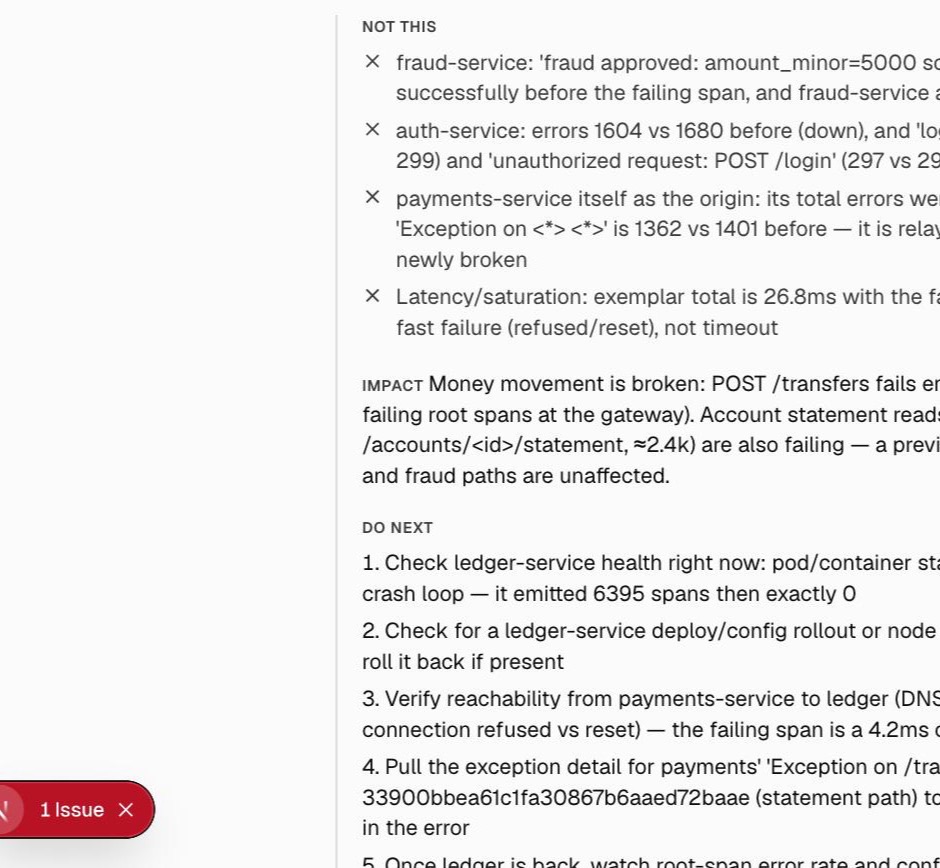
ledger-service stopped emitting spans entirely (11,806 → 0); edge-gateway and payments
/transferscalls into it fail and surface as root-span errors.Confidence: high. Check ledger-service health now — restarts, OOMKills, readiness probes. Check for a rollout around 11:07Z. Verify its datastore: a dead database can kill the process before it emits a single span.
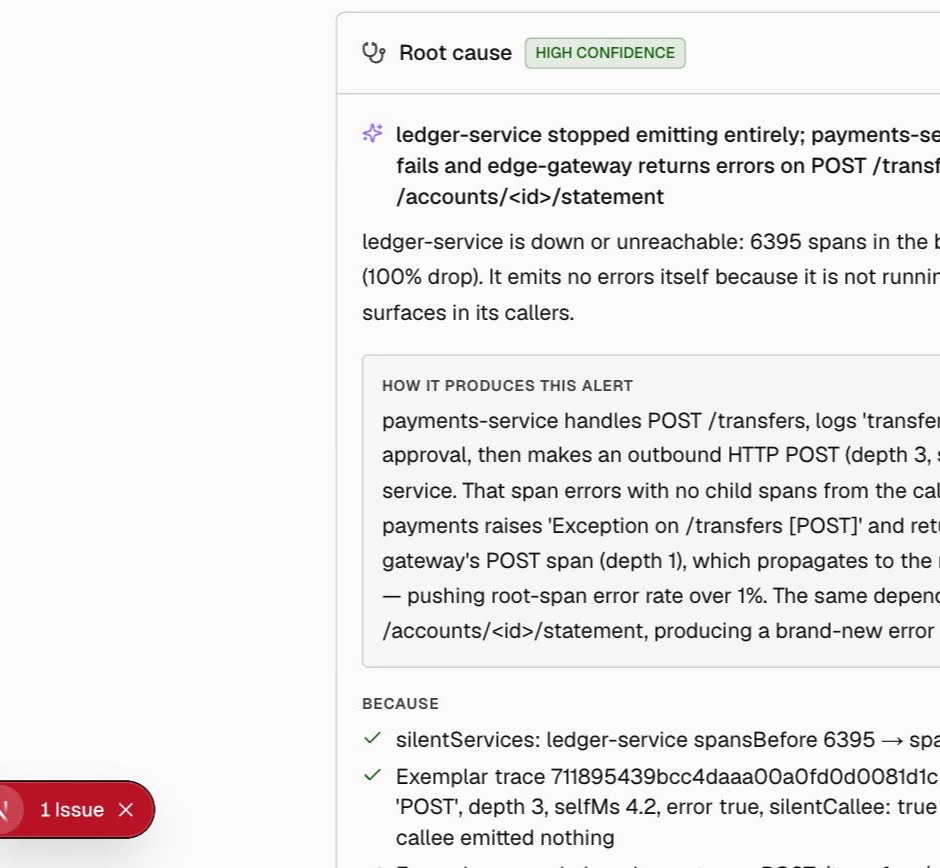
Every claim there is traceable to one of the five panels. The model did not detect anything, and it could not have — it never saw the telemetry, only the summary. That constraint is deliberate: an explanation you cannot check is worth very little at three in the morning.
Why the ranking is not a model's opinion
There is a temptation to let the model decide what matters. We don't, for a boring reason: ask a model to rank the same findings twice and you will get two slightly different orderings.
So severity is computed — from the kind of change, the log level the engineer chose when they wrote the line, the words in the message, how far the number moved, and how much of the system's traffic it represents. It produces the same ordering every time, it costs nothing, and you can read the arithmetic.
The model's job is to explain an ordering, not to invent one. It also, usefully, disagrees sometimes: on a different alert it looked at three findings our scoring rated high and reasonably talked two of them down to low, because the trace showed a business decline rather than a fault. Both numbers are shown. Arithmetic ranks; judgement annotates.
Show your working
The panel is only trusted if the evidence underneath it is one click away, so it is.
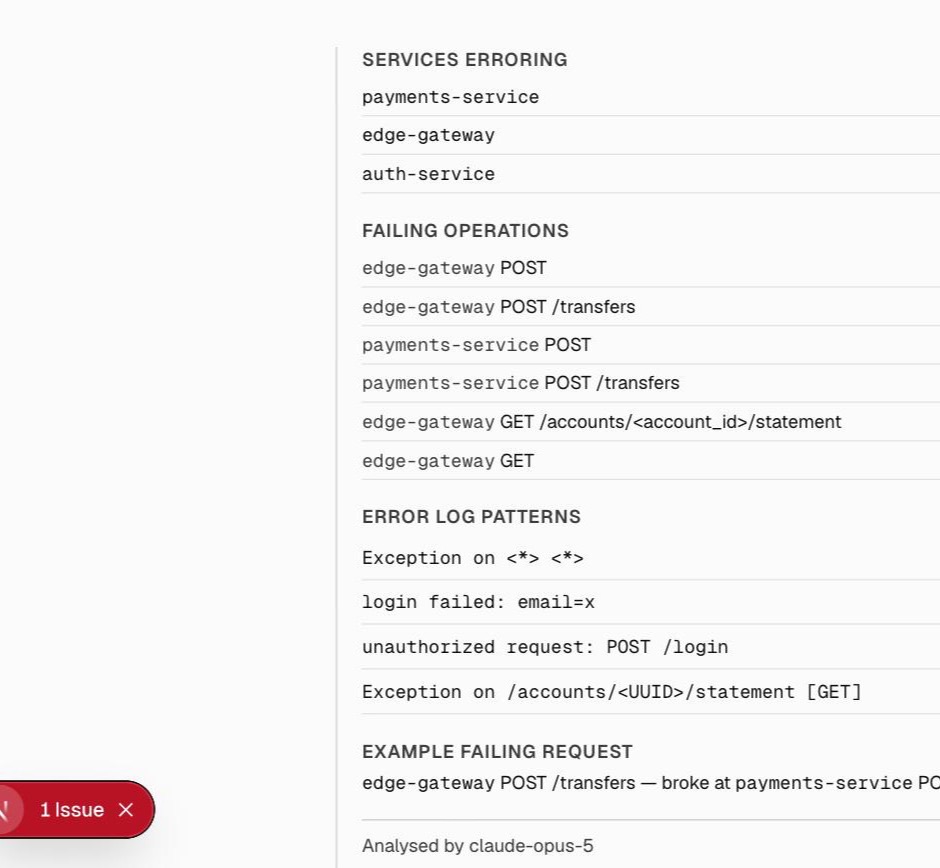
Two details in that last panel are the whole design. The services table shows
who is erroring more than before, which is how the blast radius gets bounded
without reading a single log line. And the log lines have been
collapsed into templates, so forty thousand unique messages with different
account ids become one row that says Exception on /accounts/<UUID>/statement,
with a count next to it and a note that it did not exist before.
What this is actually for
The bank exists so we can break it on purpose, at a scale where the answers are not obvious. Six services, sixty-three million spans a day, a failure that presents identically at four levels of the trace.
The result we care about is not the twenty seconds. It is that the sentence at the end of it — the ledger stopped emitting, here is the number, here is where to look — was assembled from five ordinary database queries and one request to a model that was never allowed to guess.
That is a system you can hand to whoever is on call tonight.
Frequently asked questions
How fast can distributed tracing detect a failed microservice?
In our reference bank, the first alert fired 20 seconds after we stopped the ledger service, and a second fired at 50 seconds. Both were rules whose healthy baseline is exactly zero — the count of ERROR-level logs, and the percentage of user-facing requests that fail. Rules that detect absence rather than errors are slower by design: a rule asking whether a service has gone quiet cannot fire until its evaluation window has drained the data from before the incident, which took 5 minutes 20 seconds.
Why do error-based alerts miss a crashed service?
Because a crashed service does not produce errors — it produces nothing. Its callers produce the errors, and they can only report that something downstream failed to answer. Every query that searches for errors, exceptions or failed spans will therefore describe the symptom accurately and never name the cause. The fix is to query for absence explicitly: compare each service's emission volume against the period before the incident and surface anything that collapsed.
What is the difference between an alert and a root cause?
An alert tells you a measurement crossed a threshold — error rate went above one percent. A root cause tells you which component broke and why that produces the measurement you are looking at. The gap between them is where on-call time is actually spent: identifying the service, pulling its logs, finding a failing request, and walking the call tree until the innermost failure appears.
Should an LLM decide which incidents are most severe?
No. Severity should be computed from facts — the kind of change, the log level the engineer chose when writing the line, the blast radius, the magnitude — because a model asked to rank fresh each time will produce slightly different orderings on identical input. Deterministic scoring means the same incident always ranks the same way. The model's job is to explain an ordering, not to invent one.
How much telemetry does a six-service application generate?
Our bank emits roughly 730 spans and 140 log records per second under steady load, which is about 63 million spans a day. Stored in ClickHouse this compresses about eleven to one — 660 GiB of raw telemetry occupies roughly 60 GiB on disk, with older partitions tiered automatically to object storage.

Founder & CEO, Rocketgraph
Kaushik founded Rocketgraph to make observability affordable at any scale. He writes about telemetry economics, object-storage architectures, and using AI agents to triage production incidents.